
Workshops
In collaboration with uOttawa’s IT Solutions, Digital Humanities in the Faculty of Arts is pleased to offer a virtual data visualization workshop series. Both workshops will unfold in two parts to allow for participants to first learn the tool and techniques and then have time to work on them between sessions.
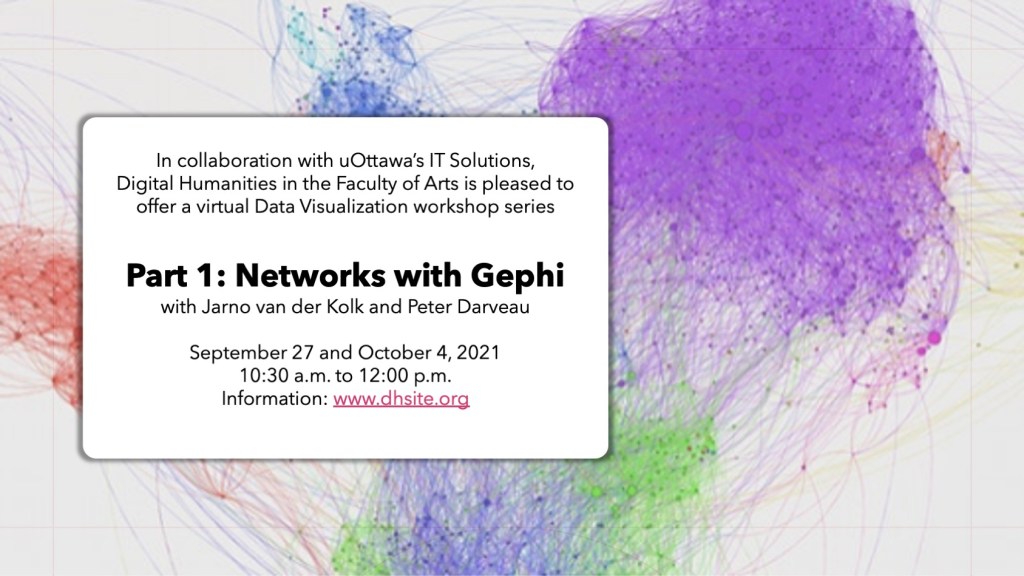
Part 1: Networks with Gephi
with Jarno van der Kolk and Peter Darveau
September 27 and October 4, 2021
10:30 a.m. to 12:00 p.m.
Visualization of data is usually one of the most important steps when interpreting the data and also for conveying the results. In the first part of the Data Visualization workshop series, we’ll use Gephi to investigate visualizing networks. For example, these can be networks of people and how they are connected to each other. While this can be done manually for a few dozen people, when you get to a few hundred, you will want some automation to help you.
View the workshop materials
Download the workshop slides.
(Re)watch the two parts of the Data Visualisation workshop on Networks with Gephi!
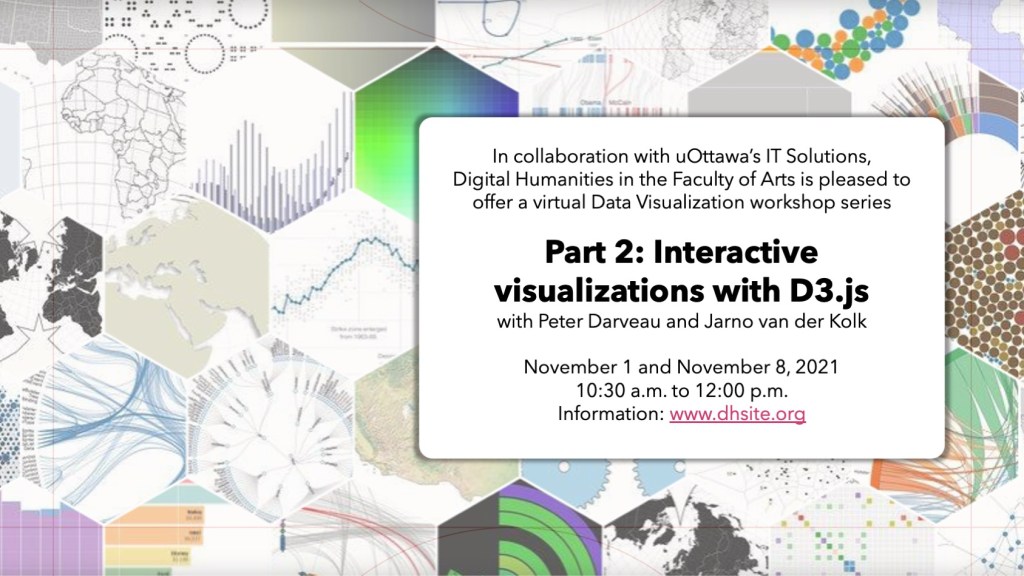
Part 2: Interactive visualizations with D3.js
with Peter Darveau and Jarno van der Kolk
November 1 and November 8, 2021
10:30 a.m. to 12:00 p.m.
The D3.js framework offers the more interactive ways of sharing data. In this second part of the Data Visualization workshop, we’ll explore how the D3.js framework can be used to create web-accessible interactive visualizations. These are dynamically generated webpages that can be part of your website. It will load data from a source you specify to generate visualizations you fully control so you can tell your story.
This workshop is in two parts. Be sure to register for both dates.
View the workshop materials
Download the workshop slides.
(Re)watch the first part of the Data Visualisation workshop on Interactive Data Visualisation with D3.js!

You must be logged in to post a comment.